Spiktel NMS is a carrier-grade, highly integrated, Network Monitoring System capable of monitoring large scale and high event networks. Spiktel NMS is a carrier-grade, highly integrated, Network Monitoring System capable of monitoring large scale and high event networks
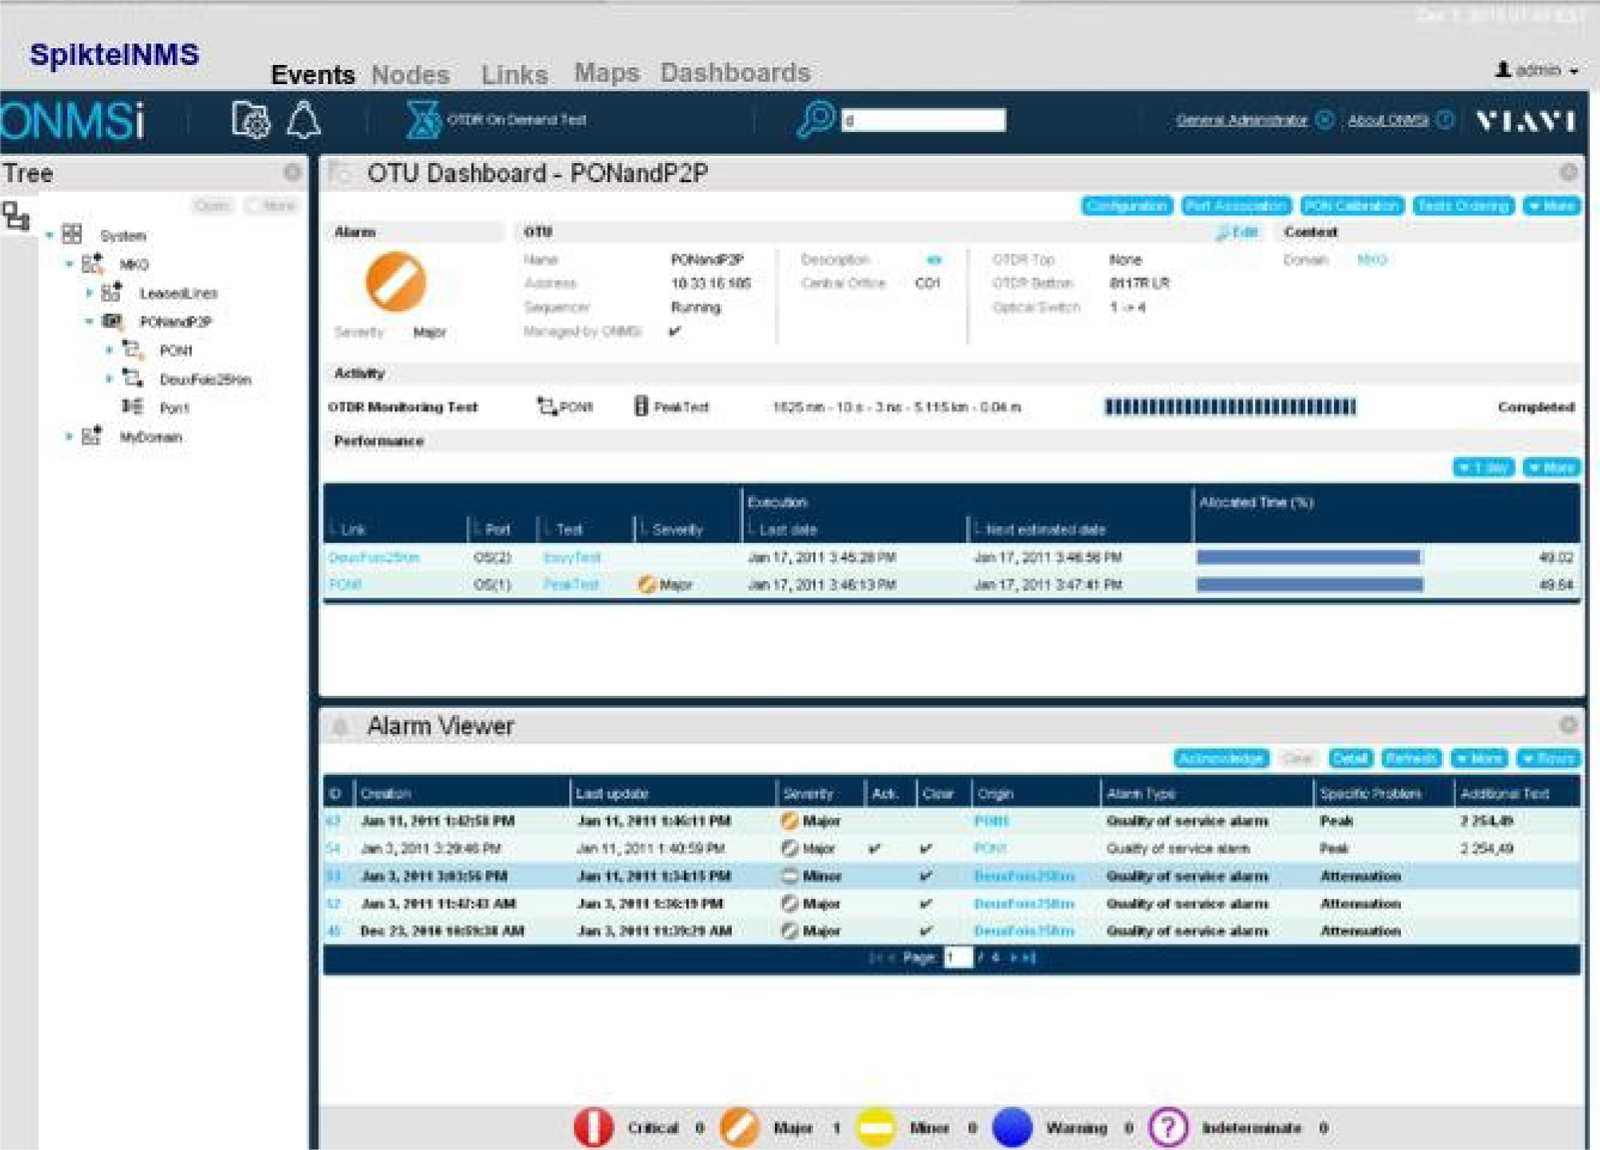
Figure: High level monitoring views of Spiktel NMS
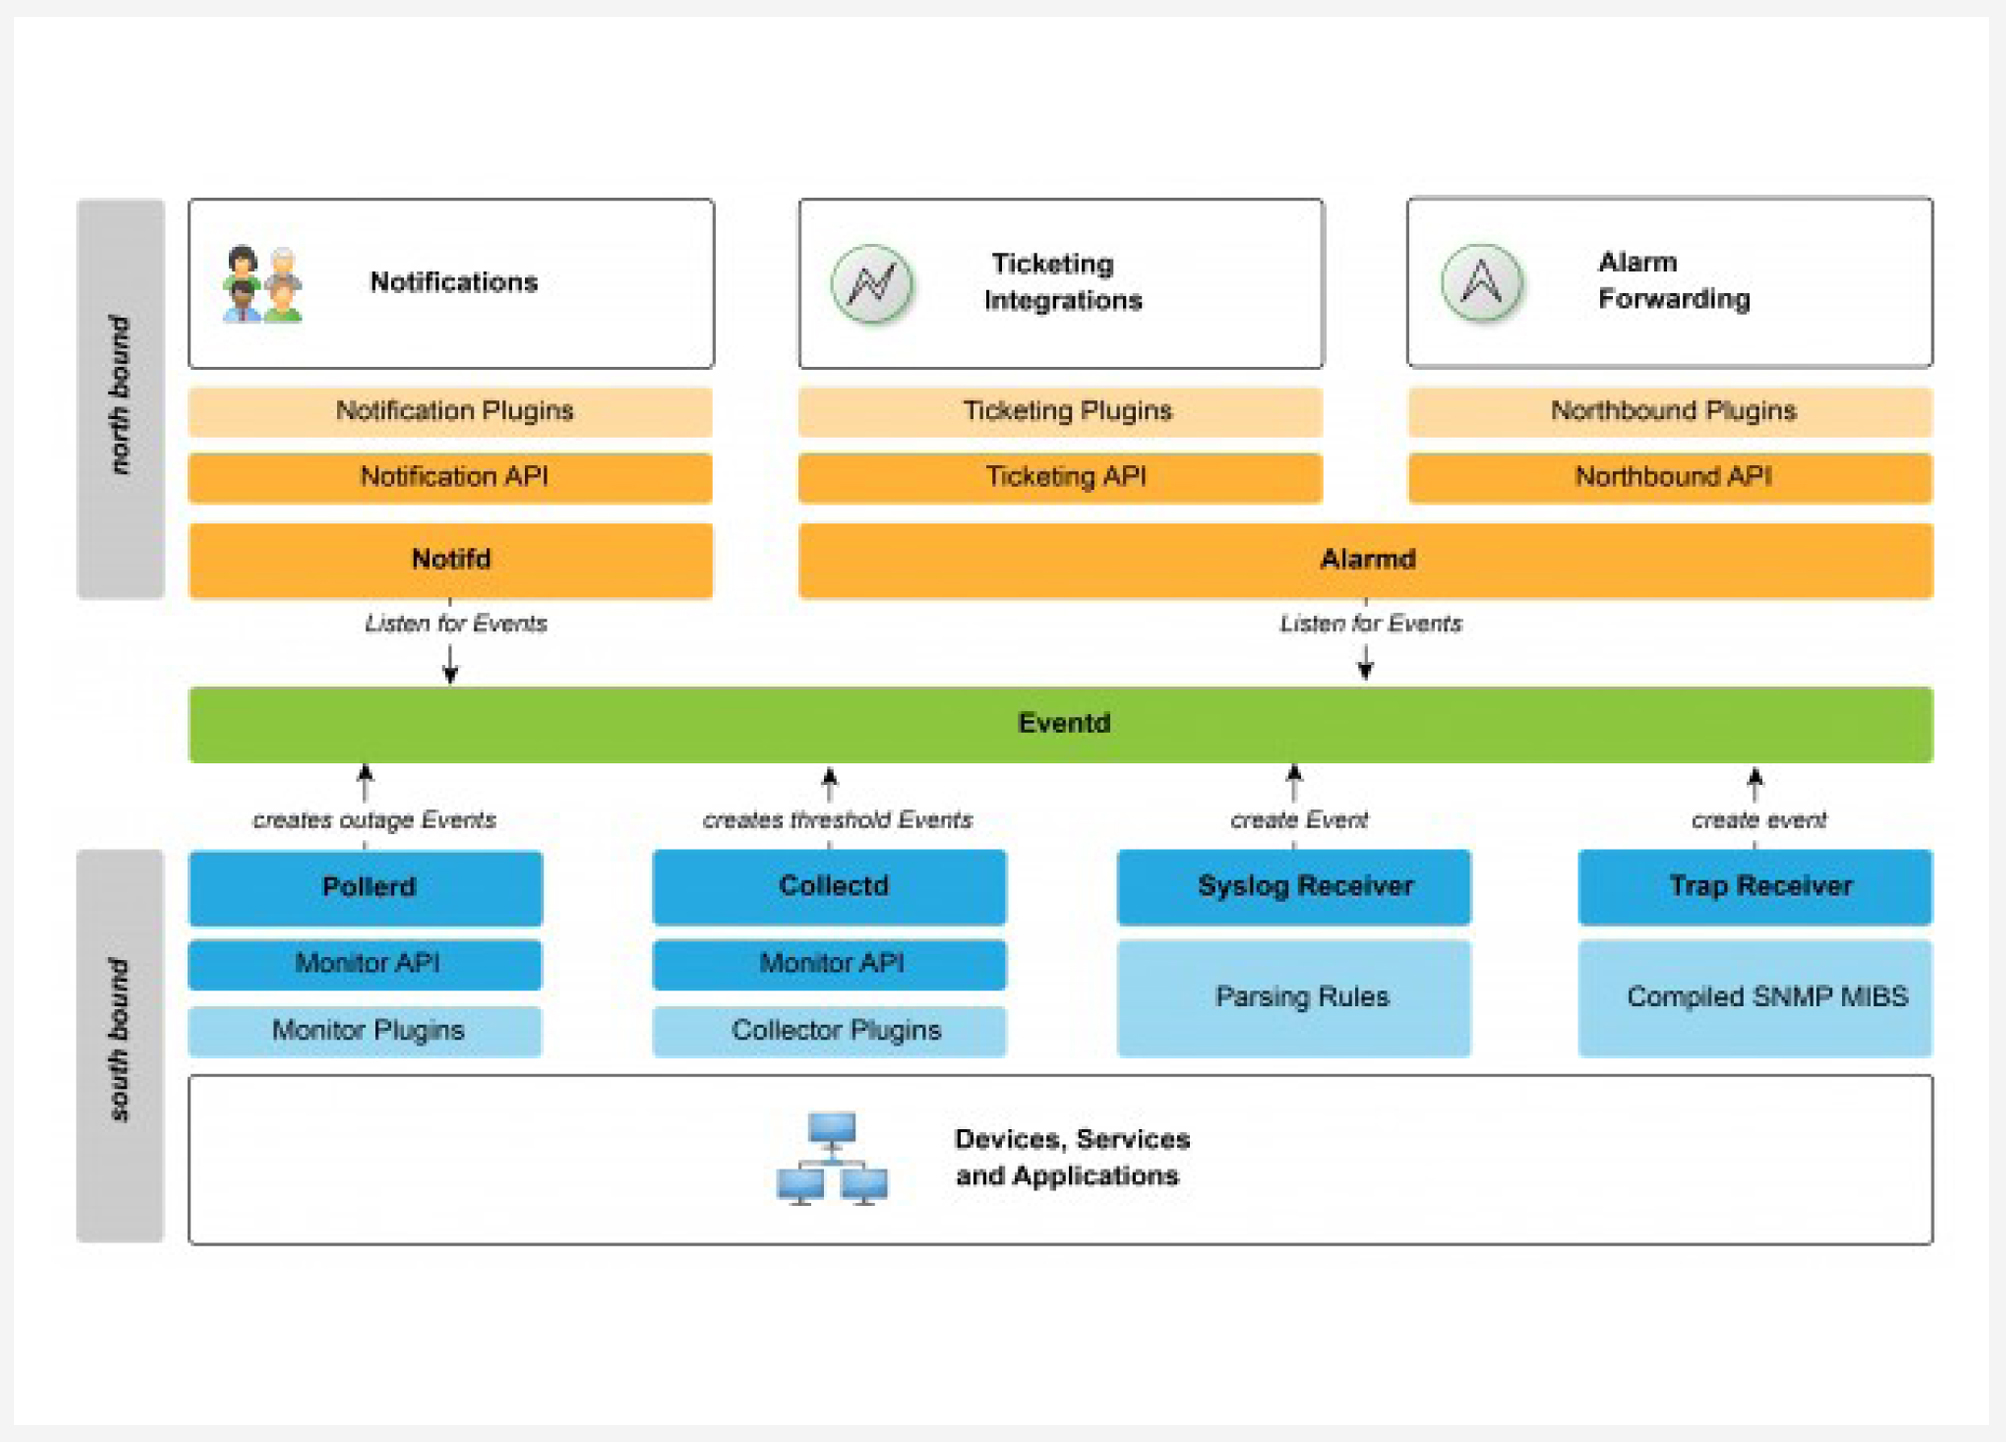
Modular architecture of Spiktel NMS
With its extensible architecture the Spiktel NMS is the best fit solution for monitoring needs of any large scale network or fiber plant future proofing the network needs as it grows.
The modular architecture of Spiktel NMS facilitates separation of concerns for the following capabilities critical to a best of breed Network Management Solution
 A 24x7 physical layer fiber monitoring syste
 Proprietary OTDR technology with optical switch to test multiple fibers
 Ruggedized, remote units to continuously tests fibers in all conditions
 Comprehensive network reporting, trends analysis and alarm management
 Customizable user interface
As defined in the TMN framework for Network Management Systems, a NMS like Spiktel NMS bridges the Element Management Solutions using standard EMS/NMS interfaces. The device specific Management Solutions are integrated into the Spiketel NMS as per the monitoring and management capabilities of the pertinent device.
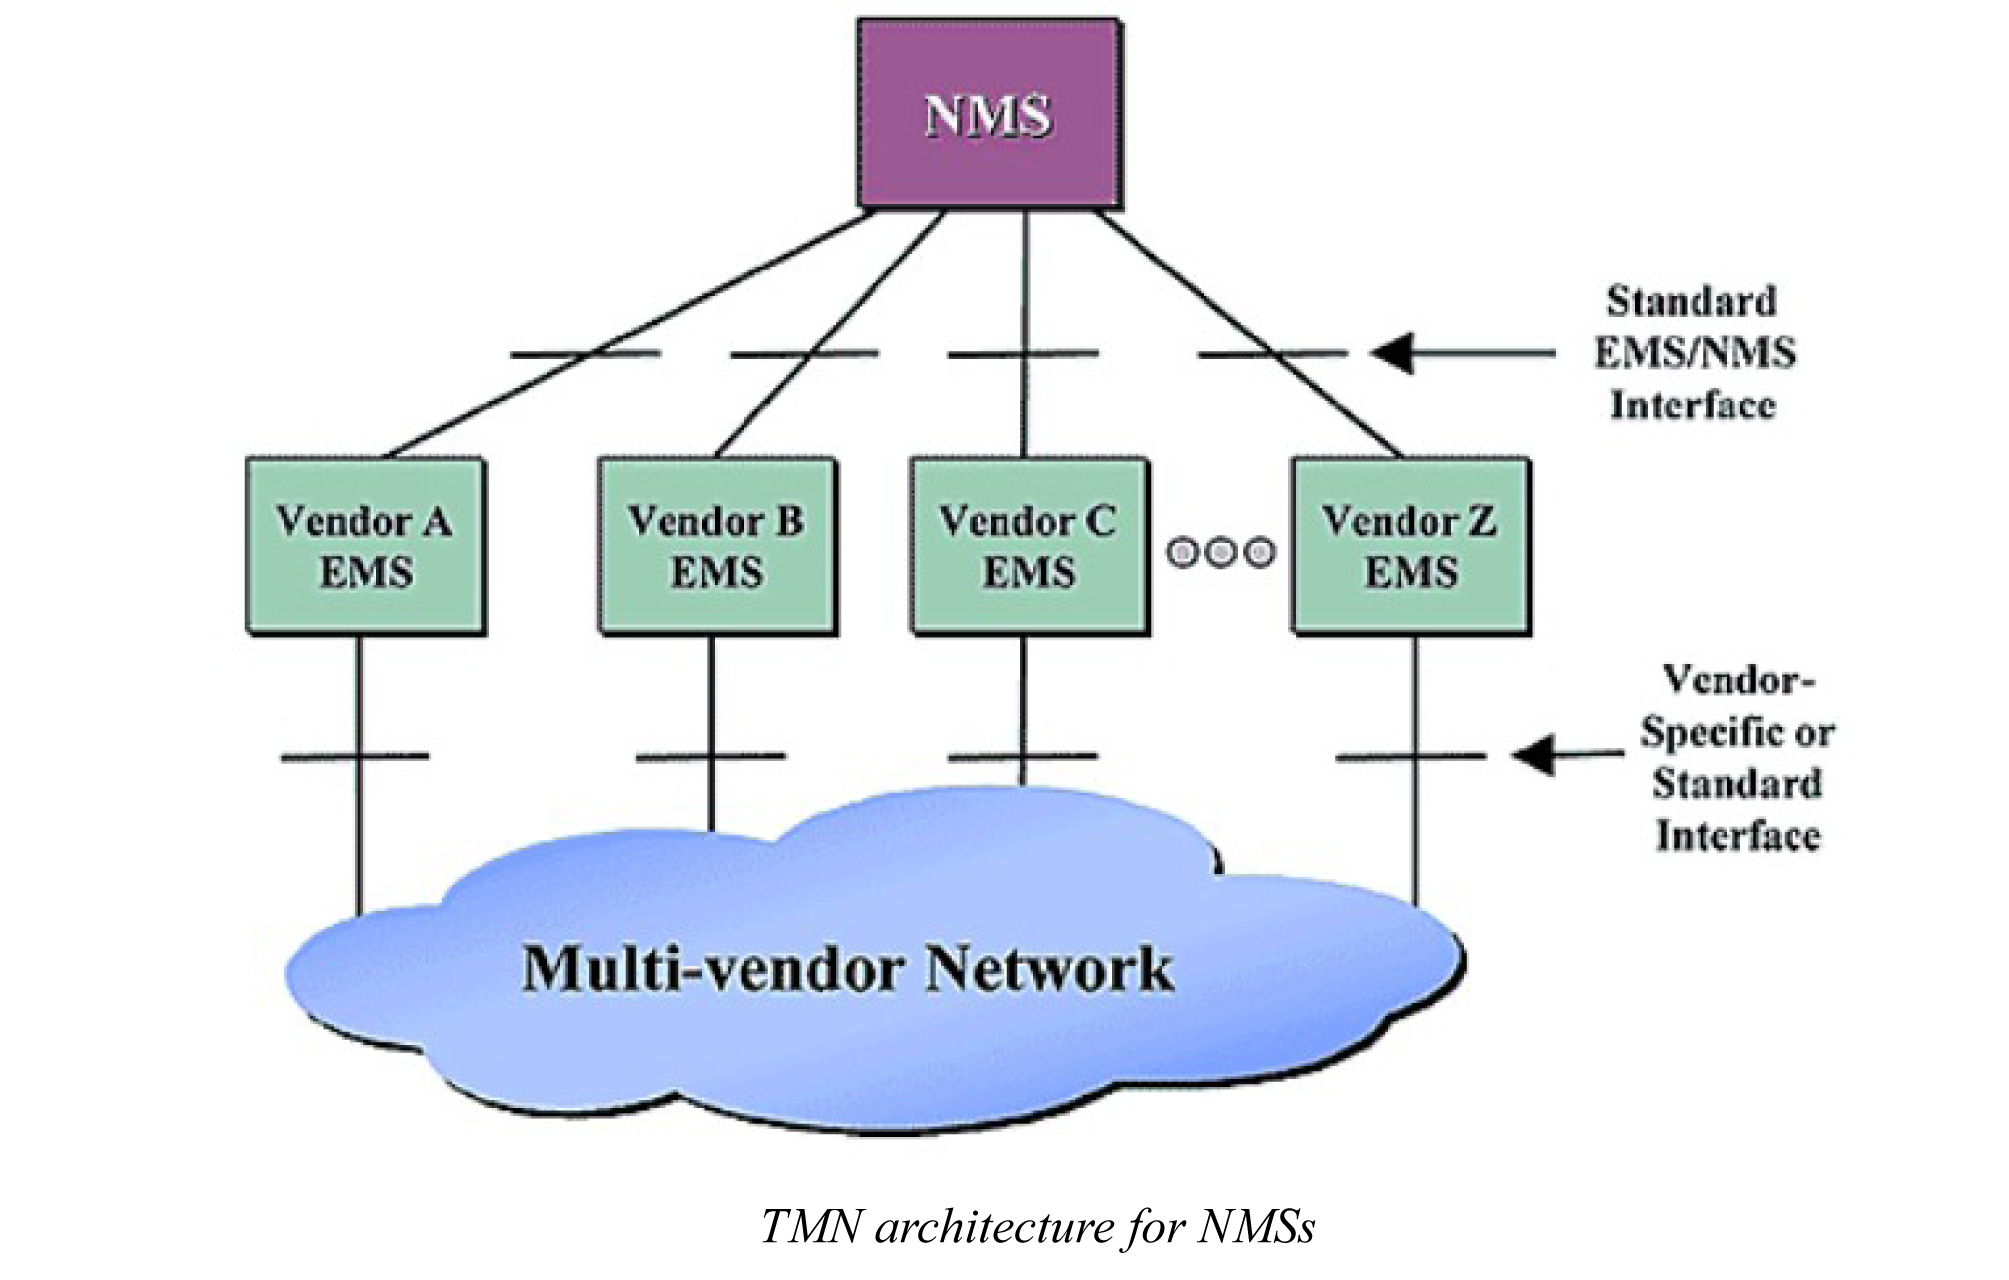
Here, for a fiber plant with diverse managed devices (NE)s the Spiktel NMS integrates with ONMSi which provides EMS capabilities in the larger context of the overall customer deployment.
Such a deployment facilitates future expansion of the Network Management framework for extending it to diverse managed devices from different vendors.
Spiktel NMS normalizes device- and vendor-specific messages and protocol-specific performance measurements. Based on robust open technologies, the data are accessible through a powerful ReST API and can be used in high level management workflow applications.
The design permits an ease of deployment and a speedy implementation in out-of-box configurationa as it leverages standards based interfaces between the ONMSi and the Spiktel NMS as per TMN forum standards.
To provide more flexibility for performance data visualization the project built a Grafana data source for Spiktel NMS. It allows to build highly customizable and interactive performance dashboards for a variety of use cases across different device types.
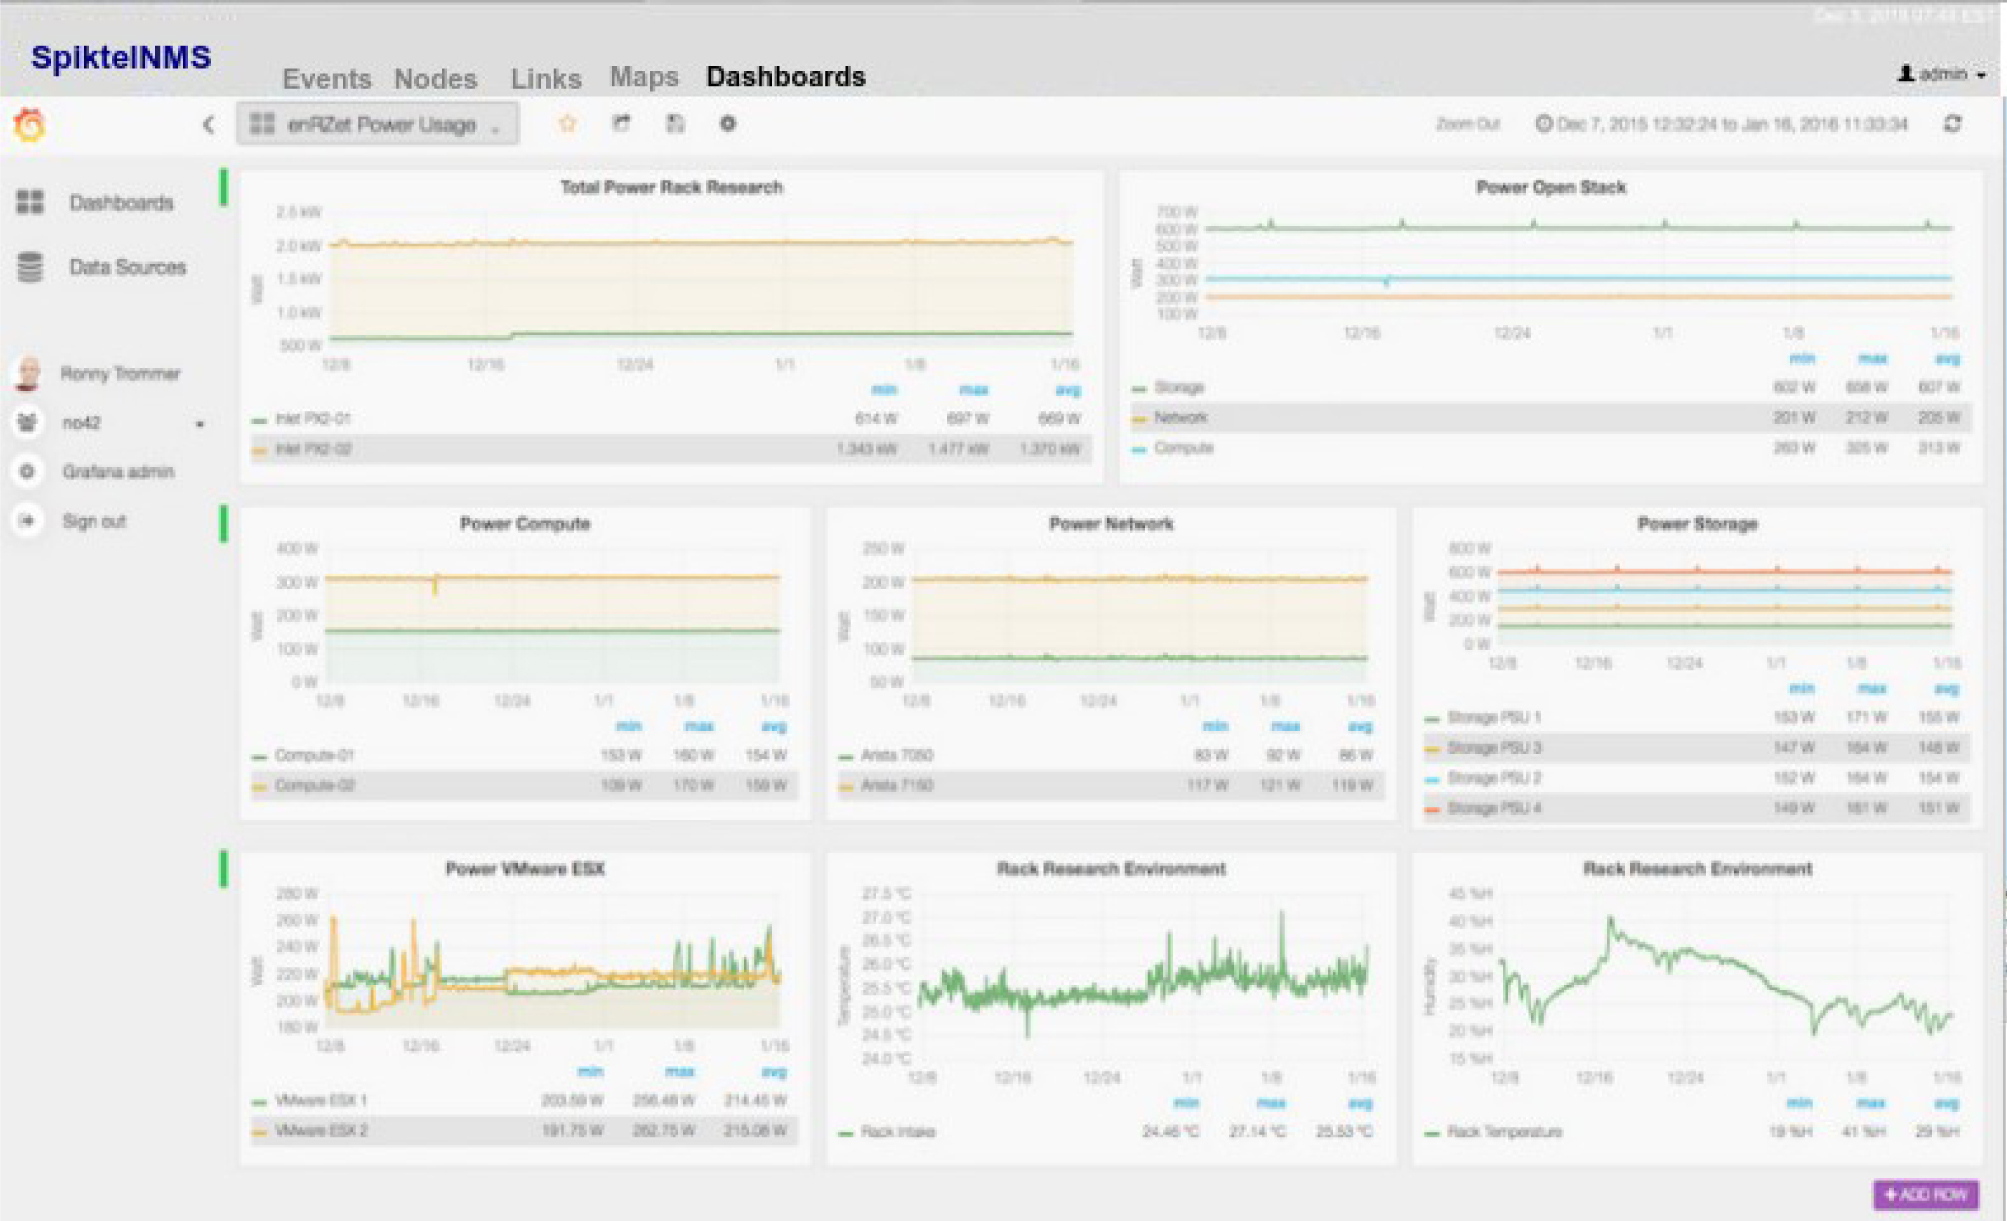
Collect performance metrics from industry standard agents via SNMP, JMX, WMI, NRPE, NSClient++ and XMP simply through configuration. Gather performance data from applications via customizable generic collectors with HTTP, JDBC, XML or JSON
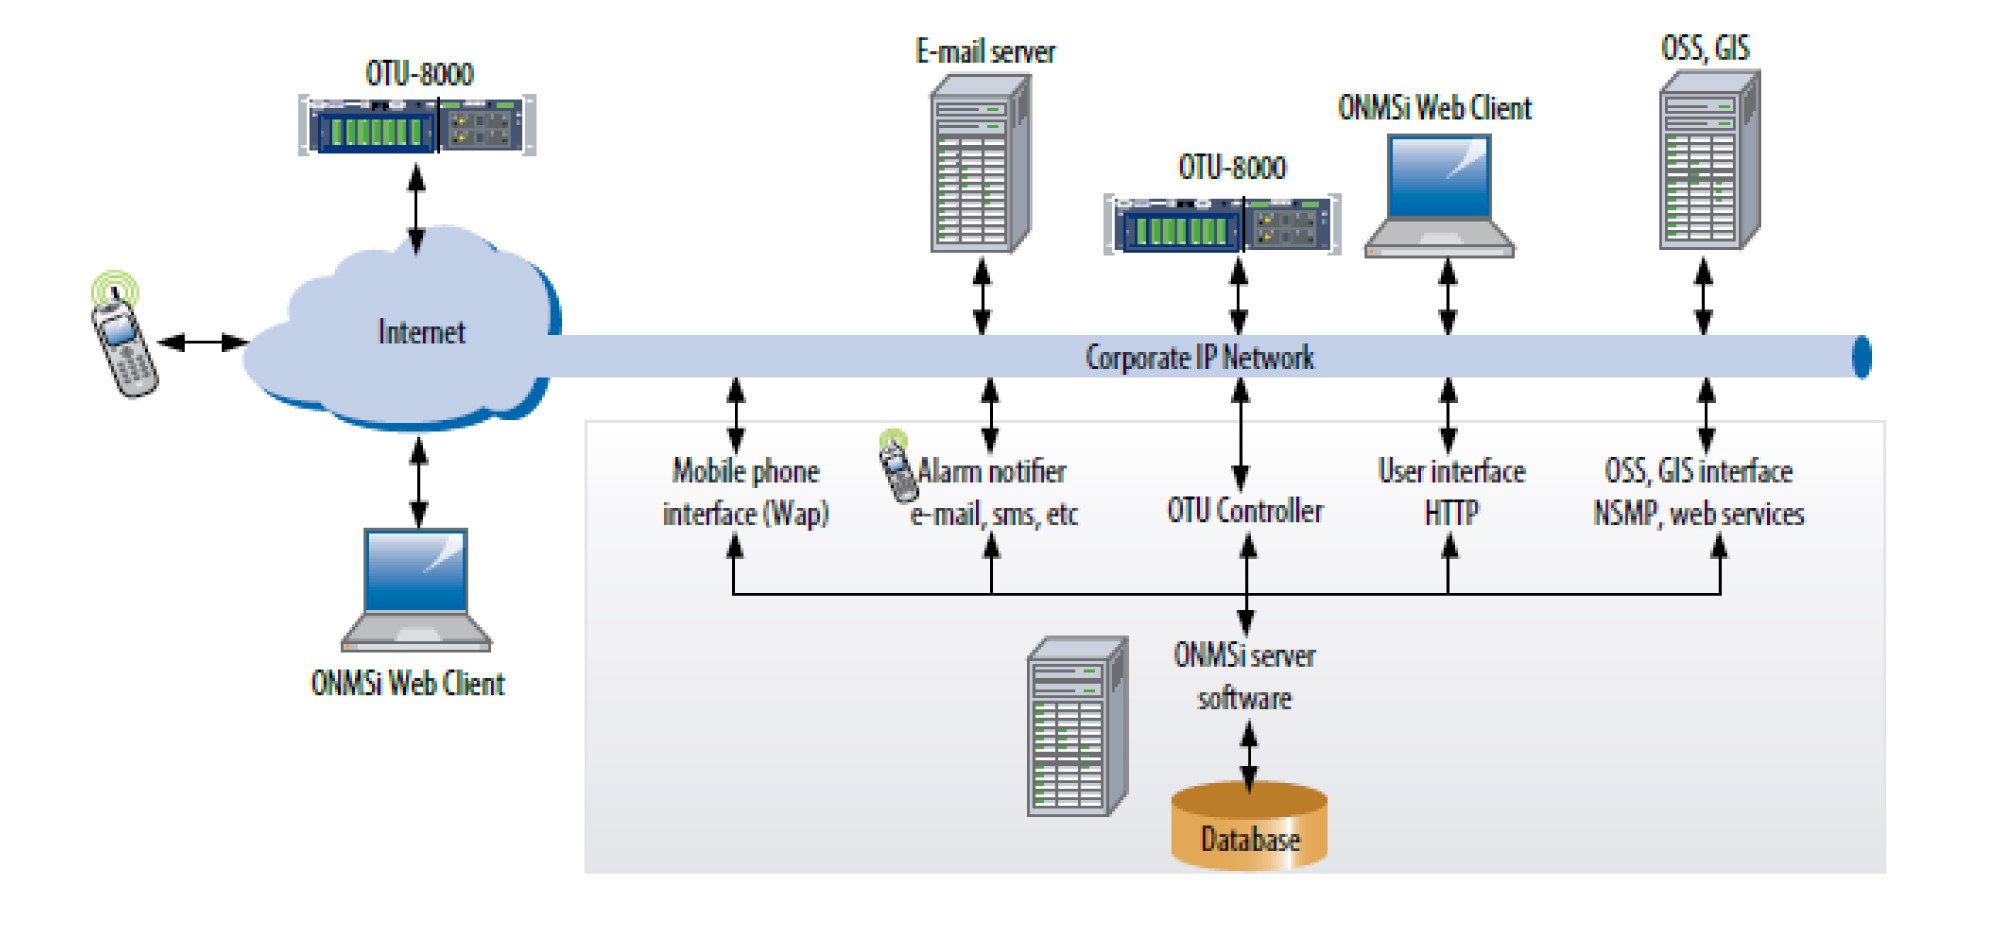
The NMS (Spiktel NMS) shall be deployed at the Nairobi Control Center (NCC). The Spiktel NMS Server shall be installed at the Nairobi, with monitoring agents at pre-destined monitoring points along the fiber, as noted in the RTU network diagram (see attached with the bid)
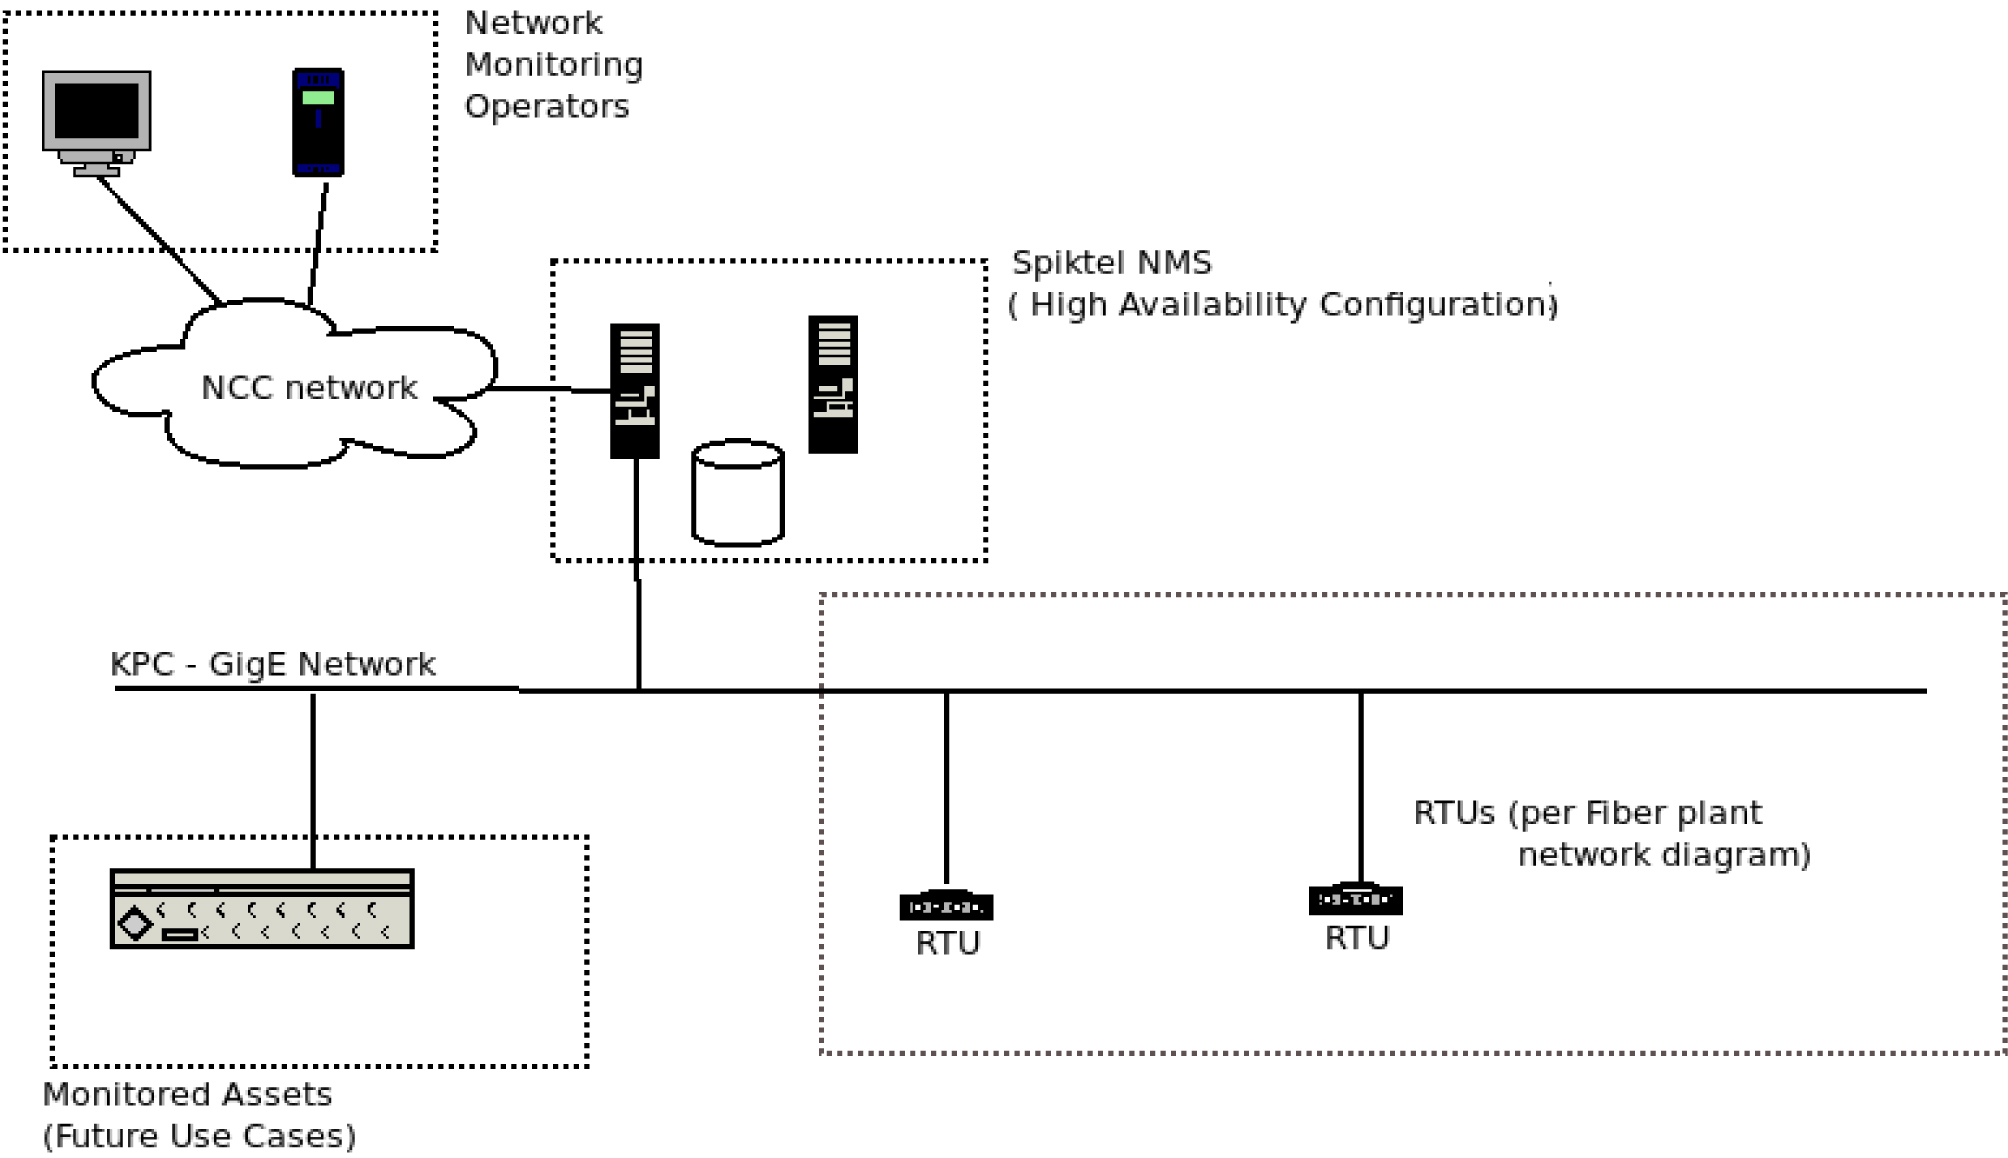
The RTU specific EMS (ONMSi) receives alerts on basis of parameter data from the RTUs and these are centralized at the Spiktel NMS to generate alerts via email/screen based alerts at the NCC
